Section 1
The part of the budget that gets often overlooked
Every token the model has seen sits in the KV cache, and it stays there for the length of the context window. The weights are a fixed cost you can read off the file. The cache is a cost you only meet once you have set a context length, and it scales with that length rather than with the model.
Qwen3.8-27B at UD-Q4_K_M is 16.2 GB of weights. Give it a 65.5k window and llama.cpp puts aside another 5.9 GB for the cache before a single token is generated. That is a third more on top of the weights alone, and it is the difference between a 24 GB card being comfortable and being full.
It is allocated, not grown
llama.cpp sizes the cache for the whole window at load time. Set 65,536 and you pay for 65,536 whether the conversation reaches it or not. So this is not a cost that only shows up in long sessions — it is there from the moment the model loads.
The dtype of that cache is a setting. We ran the four relevant ones over two evenings, same model, same quant, same 65.5k window, same card - three runs at each, four at q5_0.
| KV dtype | KV cache | VRAM measured | vs f16 |
|---|---|---|---|
| f16 (default) | 5,891 MB | 24,763 MB | — |
| q8_0 | 3,972 MB | 23,099 MB | −1.6 GB |
| q5_0 | 3,204 MB | 22,331 MB | −2.4 GB |
| q4_0 | 2,948 MB | 22,075 MB | −2.6 GB |
KV cache is Unsloth Studio's estimate from the load; VRAM measured is what the card reported during the run. Both are identical across repeats at a setting - the cache is sized at load time, so it does not vary run to run.
q4_0 halves the cache, and measured VRAM drops by 2.6 of the 2.9 GB the estimate suggests. The two numbers are close enough that the estimate is doing its job: this is real memory, not an accounting trick.
Half the cache size for a single simple setting change.
Section 2
What are the costs of halving the cache size
Nothing we can measure with our benchmark. Each setting was run three times, q5_0 four, and every run was scored on the same four scenarios. The four medians sit within 2.6 points of each other — less than the three f16 runs spread on their own.
| KV dtype | Overall | Range | Coding | Agent | Role play | Research |
|---|---|---|---|---|---|---|
| f16 (default) ×3 | 86.1 | 84.9–89.3 | 76.2 | 90.4 | 93.4 | 88.9 |
| q8_0 ×3 | 88.7 | 86.9–89.5 | 85.8 | 90.1 | 94.2 | 87.2 |
| q5_0 ×4 | 87.4 | 86.4–88.1 | 83.8 | 86.2 | 91.2 | 88.8 |
| q4_0 ×3 | 87.6 | 85.9–88.1 | 86.6 | 89.8 | 84.2 | 88.7 |
×N is how many runs that setting got. Range is the overall score across them; every one of those ranges overlaps every other.
The lowest median of the four belongs to f16, the setting that quantizes nothing. Read the ranges beside the medians and you can see why that means little: 84.9 to 89.3 at f16 alone covers the whole spread between the four medians, twice over. Every range overlaps every other range.
The per-scenario columns say the same thing louder. Role play goes 93.4, 94.2, 91.2, 84.2 - q4_0 last. Coding goes 76.2, 85.8, 83.8, 86.6 - q4_0 first and f16 last. A setting cannot be both the worst and the best choice, and with three runs behind each cell neither ordering means anything.
At 65.5k context, no clear quality loss is visible across all tested KV cache quantizations.
So: no quality cost that thirteen runs can find, anywhere between 16 bits and 4. That is not proof there is none - a difference smaller than this spread would still be invisible, and a longer context leans on the cache harder than 65.5k does. It is enough to say that if you are choosing a dtype to protect output quality, this data gives you no reason to.
Section 3
And on this card, it got faster
We went in expecting a speed penalty, because quantizing the cache means unpacking it on every attention step. On an RX 7900 XTX the opposite happened, and unlike the quality figures this one survived the repeats.
| KV dtype | Generation | Range | Prefill | Output tokens | Runtime |
|---|---|---|---|---|---|
| f16 (default) | 40.4 tok/s | 38.8–42.4 | 486 tok/s | 71,123 | 28.4 min |
| q8_0 | 51.7 tok/s | 50.5–52.1 | 538 tok/s | 65,903 | 22.3 min |
| q5_0 | 47.6 tok/s | 42.3–50.0 | 488 tok/s | 63,547 | 22.3 min |
| q4_0 | 50.3 tok/s | 50.2–54.9 | 509 tok/s | 64,999 | 19.6 min |
Every f16 run is slower than every q8_0 run and every q4_0 run. The ranges do not touch: 38.8 to 42.4 against 50.5 to 52.1 and 50.2 to 54.9. That is a gap you can act on - about 28% more tokens per second at q8_0 - and a smaller cache means less memory traffic per token, which on a card with bandwidth to spare evidently beats the cost of unpacking it.
Why less precision runs faster
Generating a token is not a compute problem, it is a memory problem. The GPU has to read the whole KV cache back for every token it produces, and it spends most of that time waiting on the memory bus rather than calculating.
Pulling 2.9 GB of q4_0 cache across that bus takes roughly half as long as pulling 5.9 GB of f16. Unpacking the quantized values costs arithmetic, and arithmetic is the thing a modern card has spare - so the read gets shorter, the maths fits in the slack, and the token arrives sooner.
One caveat survives the repeats. The runs did not all write the same amount: f16 produced a median 71,123 output tokens against 63,547 to 65,903 for the quantized settings, and a longer answer means a longer context to attend over, which slows generation on its own. Some of the gap is the model having written more rather than the cache being heavier. The effect is too small to explain an eleven tok/s difference, but it is part of it.
q5_0 is the odd one out, and it is the reason to quote a range rather than a number. Its four runs span 42.3 to 50.0 - a 7.7 tok/s spread at one fixed setting, wider than the 1.4 between the q8_0 and q4_0 medians. Its slowest run was the first of the first evening. We have no account of that, so we are not ranking the three quantized settings against each other; the result is f16 against the rest.
Section 4
The same wall, four ways
llm-bench keeps what the model wrote, so the coding scenario is not just a score. Here are the four Breakouts, first frame, no interaction.
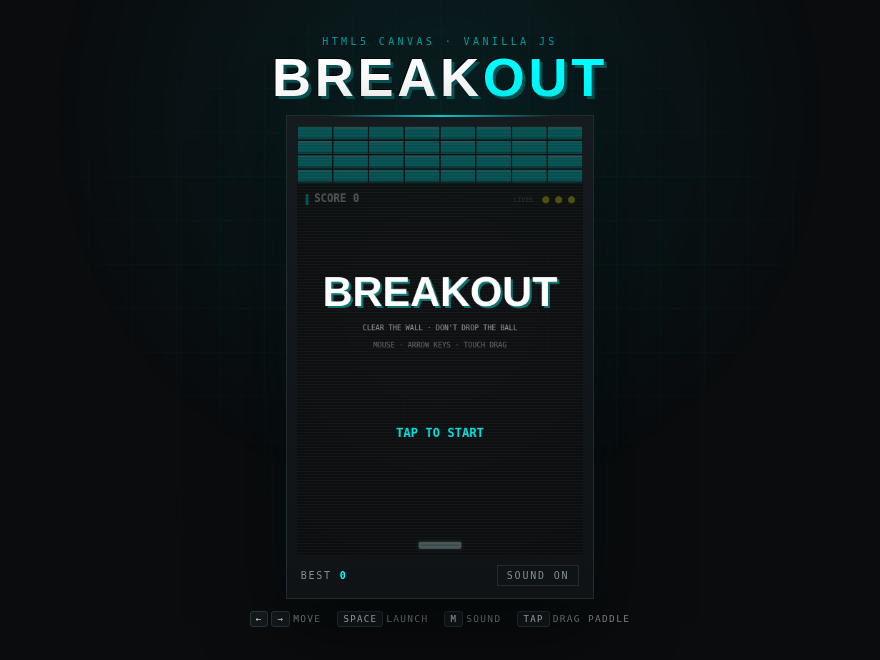
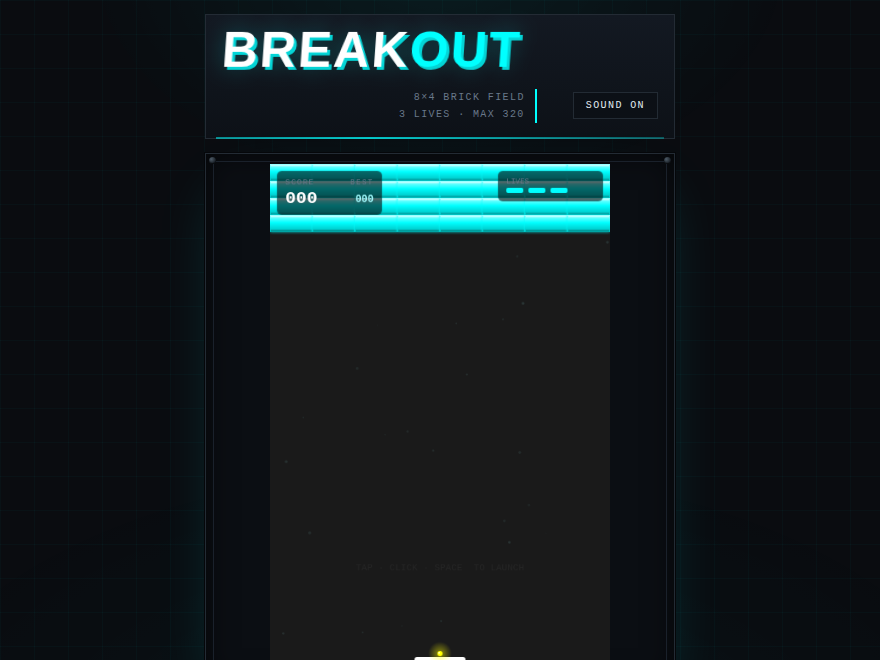
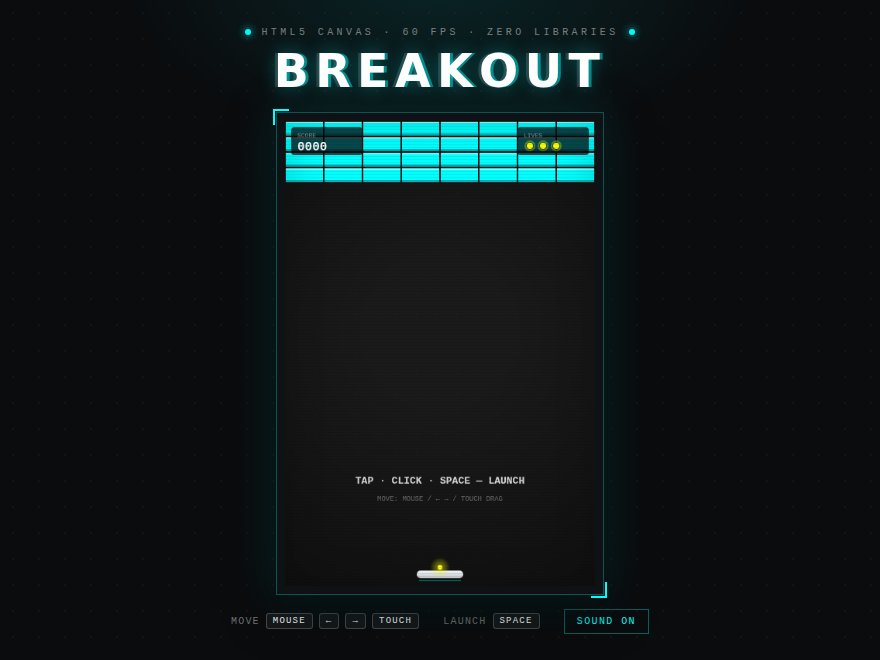
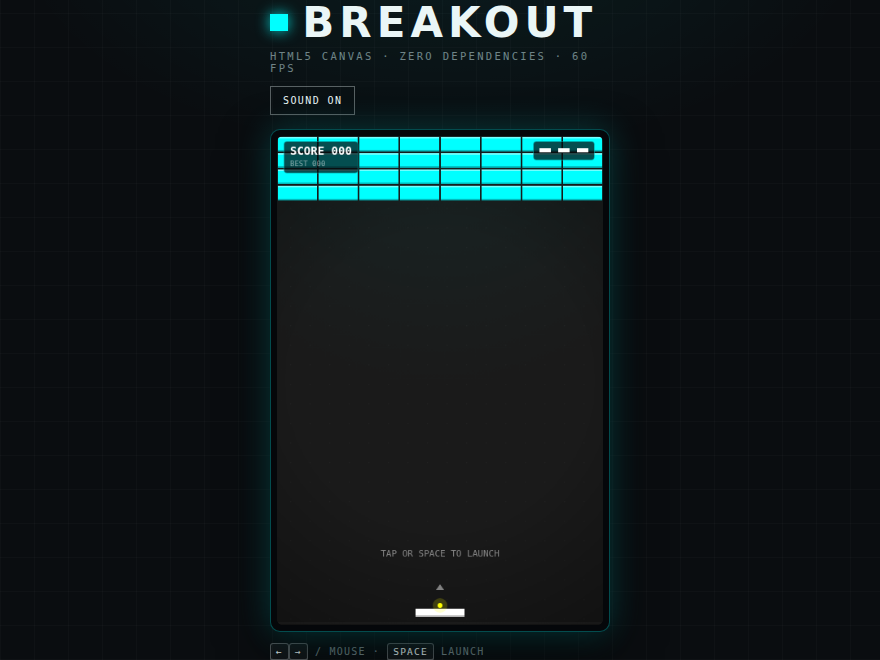
First frame as rendered in a headless browser, no interaction. All four are playable from their benchmark pages. One run each, from the first evening — the f16 game shown scored 80.8 on coding, which is the best of its three runs, not the median 76.2.
All four are the same game: eight columns by four rows, three lives, one paddle, one ball. Nothing degraded into a broken program at 4 bits, which was the failure we were watching for.
There is one visible pattern and we do not trust it. Three of the four draw the score and lives on top of the brick field, where they are hard to read; only f16 puts the HUD below the bricks. It is tempting to read that as the quantized cache losing track of the layout it planned. But these are one run per setting, and f16 has the lowest median of the four on the coding scenario — whatever the pictures suggest, the scores behind them do not support it. Treat them as four examples of what the model builds.
Nothing broke at 4 bits.
Section 5
What settings we would recommend
Set q8_0. On this card it was the fastest setting we measured and the highest scoring, it gives back 1.6 GB at 65.5k, and 8 bits is close enough to 16 that there is little left to lose. Across thirteen runs the untouched default is the one setting with nothing to recommend it.
Go further when you need the memory. q4_0 halves the cache, and across thirteen runs it is indistinguishable from q8_0 on both speed and quality. There is no evidence here for stopping at 5 or 8 bits on quality grounds — only the general caution that our context was 65.5k, and a longer one leans on the cache harder.